Animations
Selected animations from simulations of lipids and related molecules. VMD was used for some of the short movies, but for many the CHARMM graphics facility was used to read coordinate trajectory data and export files for POV-Ray, a popular and freely available ray-tracing program. Freely available MPEG-1 encoders (mpeg_encode, ppmtompeg) were used to create the animations by processing the PPM image files produced by POV-Ray.
Comparison of Two Membrane-bound Peptides
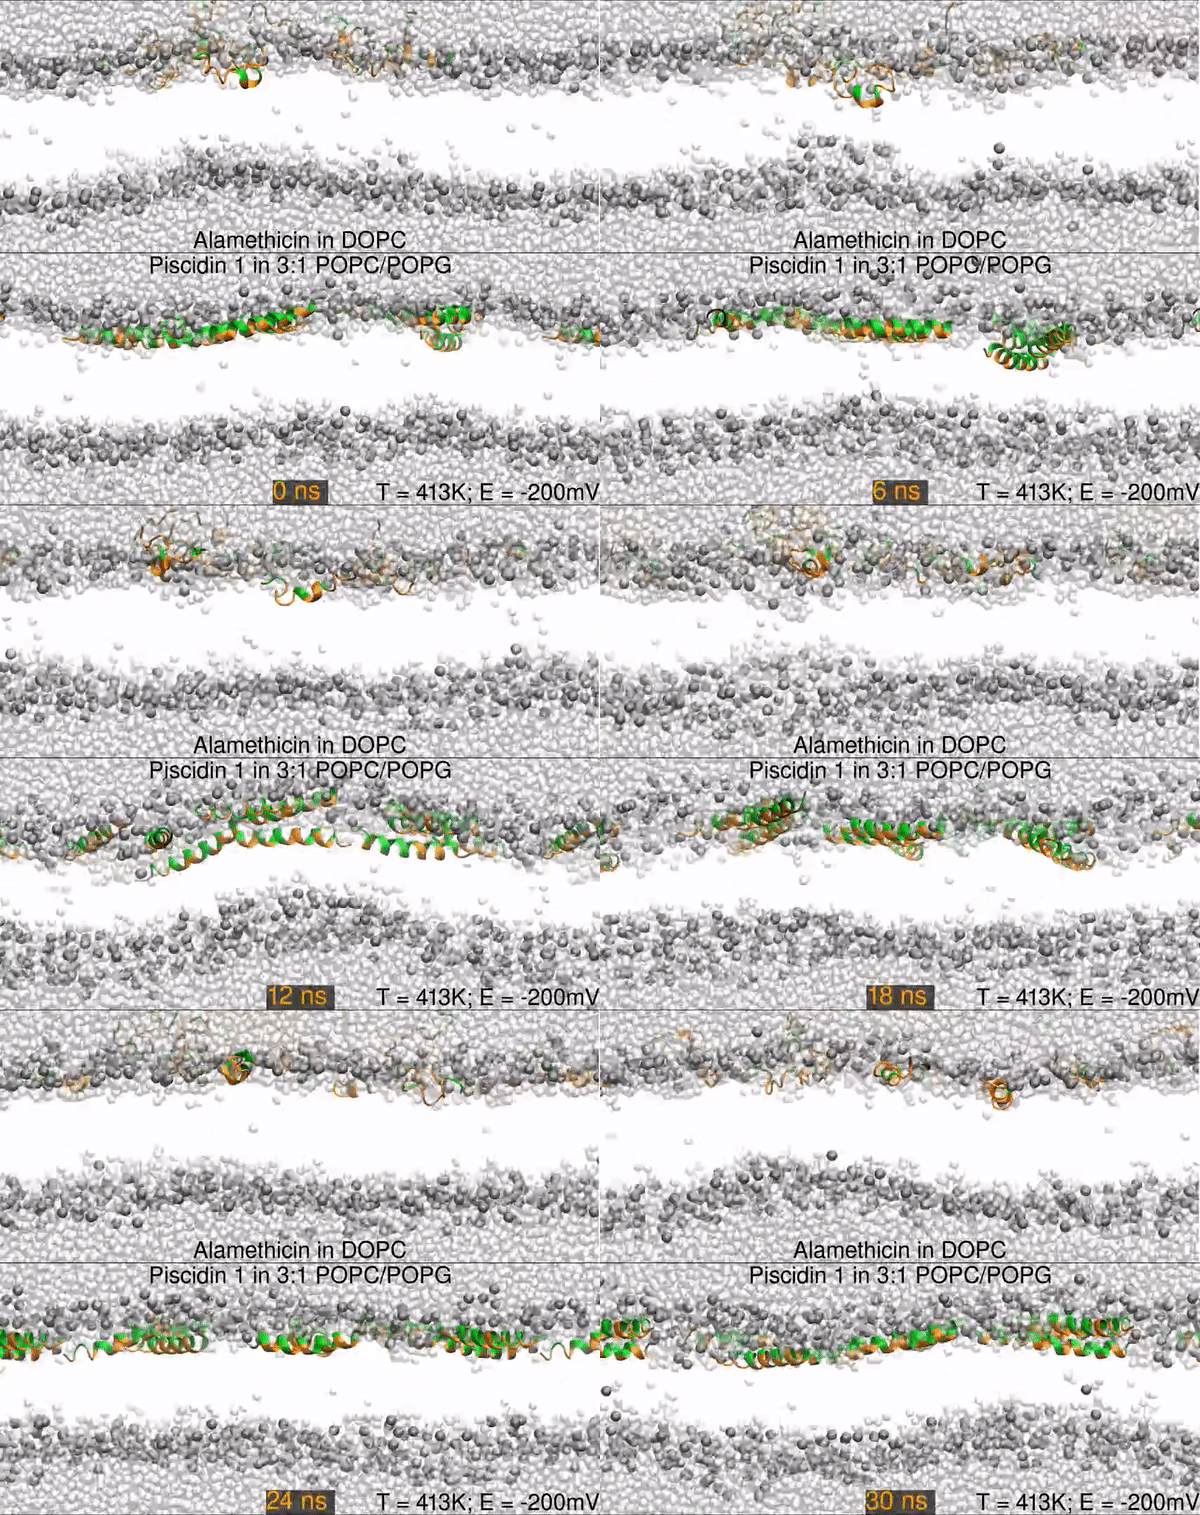
Two different peptides simulated in lipid bilayers using all-atom molecular dynamics. The top panel shows a 1000 nanosecond simulation of the antibiotic peptide alamethicin in DOPC (1,2-dioleoyl-sn-glycero-3-phosphocholine), and the bottom panel shows the antimicrobial peptide piscidin 1 in 3:1 POPC/POPG (1-palmitoyl-2-oleoyl-sn-glycero-3-phosphocholine/1-palmitoyl-2-oleoyl-sn-glycero-3-phosphoglycerol). Peptides are shown as orange (hydrophobic residues) and green (polar and charged residues) ribbons, water molecules are shown as light gray spheres, and the lipid phosphorus are dark gray spheres. The rest of the lipids are omitted for clarity (the empty white band is the hydrophobic interior of the membrane).
The primary result is that alamethicin is unstable on the membrane surface, buries itself into the membrane, and folds into a helix; while the piscidin 1 helix is optimized for binding the water-membrane interface. Hence, 10 alamethicin peptide begin on the surface and insert in 1000 ns, and the 10 piscidin peptides remain surface-bound. After 300 ns, the simulation skips to 950 ns.
Simulations were performed at 413K with a -200mV electric field.
Citations:
"Simulations of Membrane-Disrupting Peptides I: Alamethicin Pore Stability and Spontaneous Insertion." B. Scott Perrin and Richard W. Pastor, Biophysical Journal, 111, 6, pages 1248-1257 doi: http://dx.doi.org/10.1016/j.bpj.2016.08.014.
"Simulations of Membrane-Disrupting Peptides II: AMP Piscidin 1 Favors Surface Defects over Pores." B. Scott Perrin Jr.1, Riqiang Fu2, Myriam L. Cotten3, Richard W. Pastor, Biophysical Journal, 111, 6, 1258-1266 doi: http://dx.doi.org/10.1016/j.bpj.2016.08.015.
All-atom MD simulations of Alamethicin and Piscidin Pores
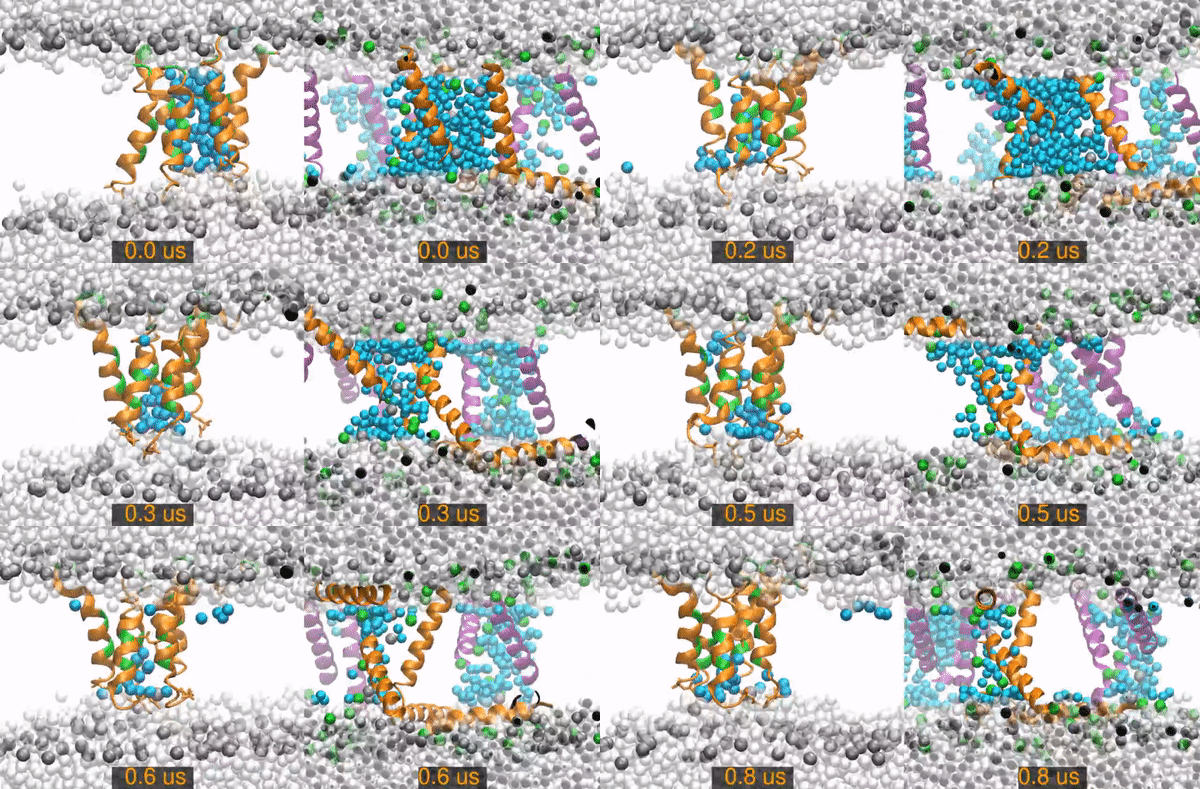
All-atom molecular dynamics simulations of two peptides starting from barrel-stave pore conformations.
Left) A 14.1 microsecond trajectory of the antibiotic peptide alamethicin in DOPC (1,2-dioleoyl-sn-glycero-3-phosphocholine). Alamethicin peptides are shown as orange (hydrophobic residues) and green (polar and charged residues) ribbons, water molecules are distinguished as in the pore (cyan spheres) or non-pore (light gray spheres), and the lipid phosphorus are dark gray spheres. The rest of the lipids are omitted for clarity (the empty white band is the hydrophobic interior of the membrane).
Right) A 20 (of 26) microsecond trajectory of the antimicrobial peptide piscidin 1 in 3:1 POPC/POPG (1-palmitoyl-2-oleoyl-sn-glycero-3-phosphocholine/1-palmitoyl-2-oleoyl-sn-glycero-3-phosphoglycerol). This movie focuses on one of four pores in the simulation. The pore Peptides that started in this pores are orange, those from neighboring pores are purple. Water molecules are distinguished as in the pore (cyan spheres) or out of the pore (light gray spheres). Gray spheres are POPC phosphorus atoms and green sphere are POPG phosphorus atoms. The rest of the lipids are omitted for clarity.
The primary result is that the alamethicin peptides remain as a stable peptide pore for the entire 14 microseconds. In contrast, the piscidin pores quickly become disordered and incorporate lipids between the peptides. The pore collapses and all of its peptides are surface-bound by 15.2 microseconds.
Citations:
"Simulations of Membrane-Disrupting Peptides I: Alamethicin Pore Stability and Spontaneous Insertion." B. Scott Perrin and Richard W. Pastor, Biophysical Journal, 111, 6, pages 1248-1257 doi: http://dx.doi.org/10.1016/j.bpj.2016.08.014.
"Simulations of Membrane-Disrupting Peptides II: AMP Piscidin 1 Favors Surface Defects over Pores." B. Scott Perrin Jr.1, Riqiang Fu2, Myriam L. Cotten3, Richard W. Pastor, Biophysical Journal, 111, 6, 1258-1266 doi: http://dx.doi.org/10.1016/j.bpj.2016.08.015.
H-bond Network in Sphingomyelin Headgroups
The hydrogen bond network, a feature of sphingolipids, is shown as transparent orange cylinders which at times flicker, appear, or disappear. Palmitoyl sphingomyelin headgroup fragments for a single leaflet of the membrane are shown w/o most H atoms, and with the chains truncated. The PO4 groups are green, the N(CH3)3 group is purple, amide N atom is blue, C atoms are gray, O atom acceptors are red, and H atom donors are white.
Citation: "CHARMM All-Atom Additive Force Field for Sphingomyelin: Elucidation of Hydrogen Bonding and of Positive Curvature." Richard M. Venable, Alexander J. Sodt, Brent Rogaski, Huan Rui, Elizabeth Hatcher, Alexander D. MacKerell, Jr., Richard W. Pastor, and Jeffery B. Klauda, submitted for publication
Piscidin 3 Peptide tilt Fluctuations in a DMPG/DMPC Bilayer
Closeup of amphipathic peptide piscidin 3, with heavy atoms as spheres embedded in a mixed lipid membrane, with the lipids shown in stick form to represent the chemical bonds. Hydrophobic residues (brown) are in contact with the hydrocarbon interior of the membrane (gray chains), while the charged Arg and Lys sidechains (dark gray with cyan N atoms) project upward into the aqueous region. The peptide is seen to rock slightly over the 20 ns interval, with a couple of more abrupt shifts in the tilt, which is close to flat in the plane of the membrane (90 deg, +/- 10 deg). A plot at the bottom shows the tilt as a function of time, with a small blue triangle to mark the tilt for the current frame.
Citation: High-Resolution Structures and Orientations of Antimicrobial Peptides Piscidin 1 and Piscidin 3 in Fluid Bilayers Reveal Tilting, Kinking, and Bilayer Immersion. B. Scott Perrin, Jr., Ye Tian, Riqiang Fu, Christopher V. Grant, Eduard Y. Chekmenev, William E. Wieczorek, Alexander E. Dao, Robert M. Hayden, Caitlin M. Burzynski, Richard M. Venable, Mukesh Sharma, Stanley J. Opella, Richard W. Pastor, and Myriam L. Cotten. J. Am. Chem. Soc., 2014. doi:10.1021/ja411119m
Na+ Ions Condensing on a POPS Bilayer Surface
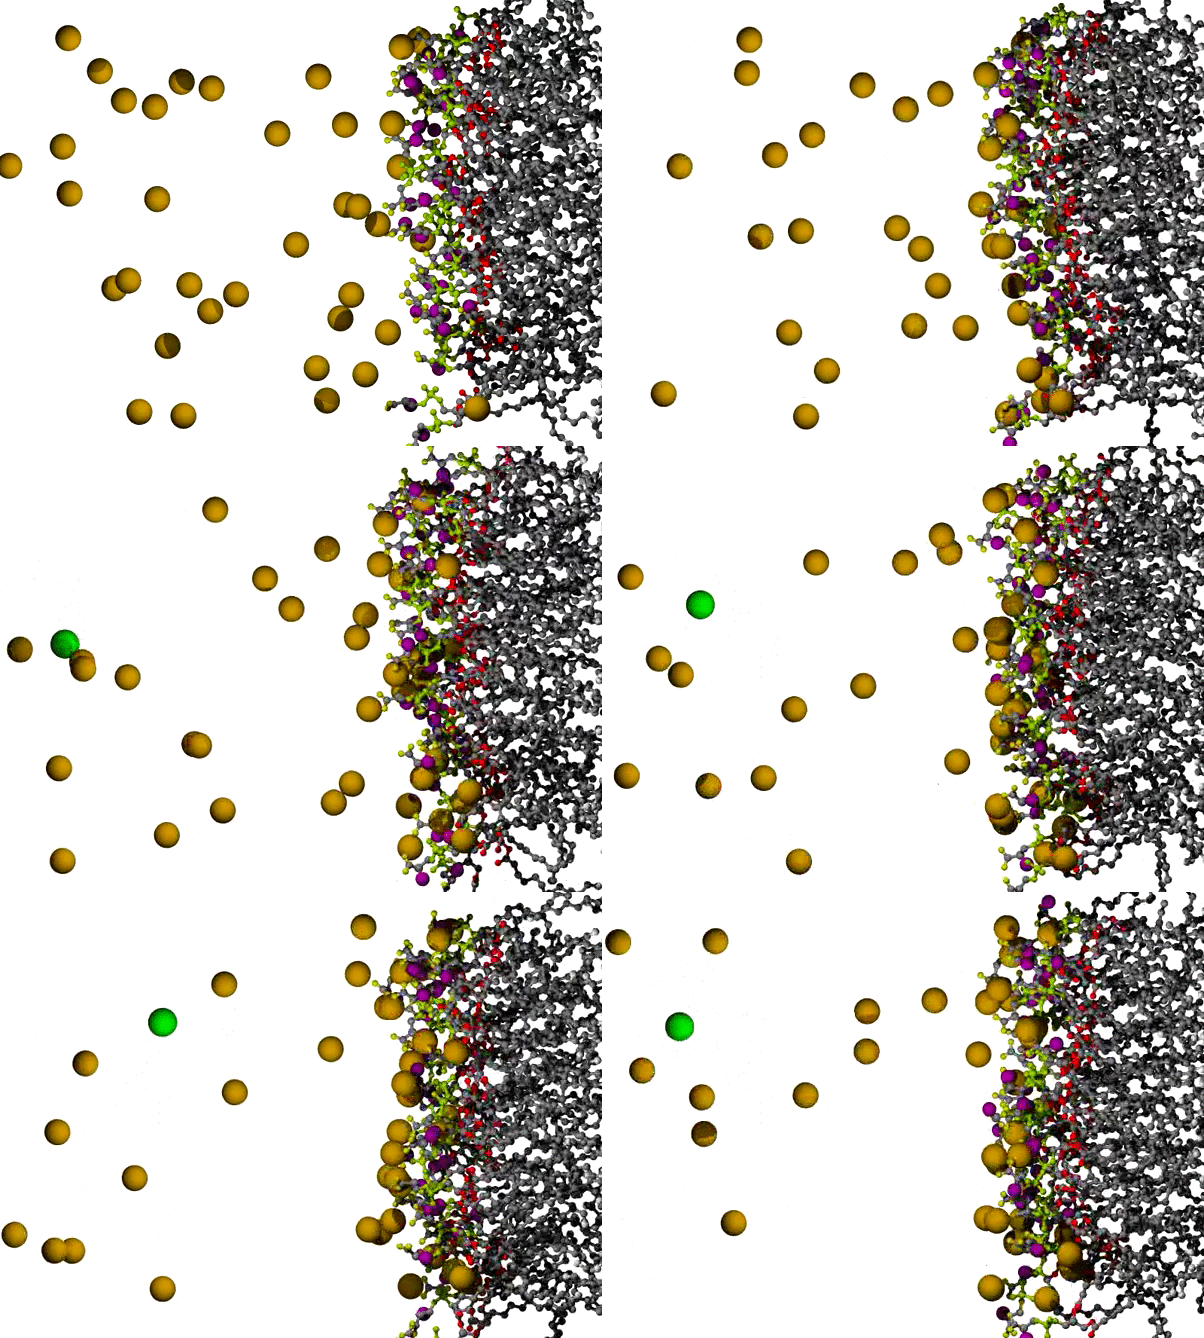
POPS* bilayer with Na+ to neutralize, and a small excess of NaCl, with the surface of one leaflet shown at the right, and the orange Na+ ions dispersed across the remaining 3/4 of the view. The lipids are shown in ball and stick form, resembling plastic molecular models, with C atoms in gray, ester O atoms in red, PO4 group in yellow-green, carboxylate O in yellow, and amide N in purple. The ions are shown as VDW radius spheres, with green for Cl- ions which appear on the left partway through the animation; water has been omitted for clarity. The first 500 ps of a long simulation are shown; the randomly placed Na+ ions are observed to condense on the negatively charged surface fairly quickly.
* POPS = palmitoyl-oleoyl-phosphatidylserine
Citation: Simulations of Anionic Lipid Membranes: Development of Interaction-Specific Ion Parameters and Validation Using NMR Data Venable, Richard M.; Luo, Yun; Gawrisch, Klaus; Roux, Benoit; Pastor, Richard W. J. Chem. Phys. B, 117, 10183-10192 (2013).
VMD Movies of Molecular Assemblies as a Function of Mole % PEGylated Lipid
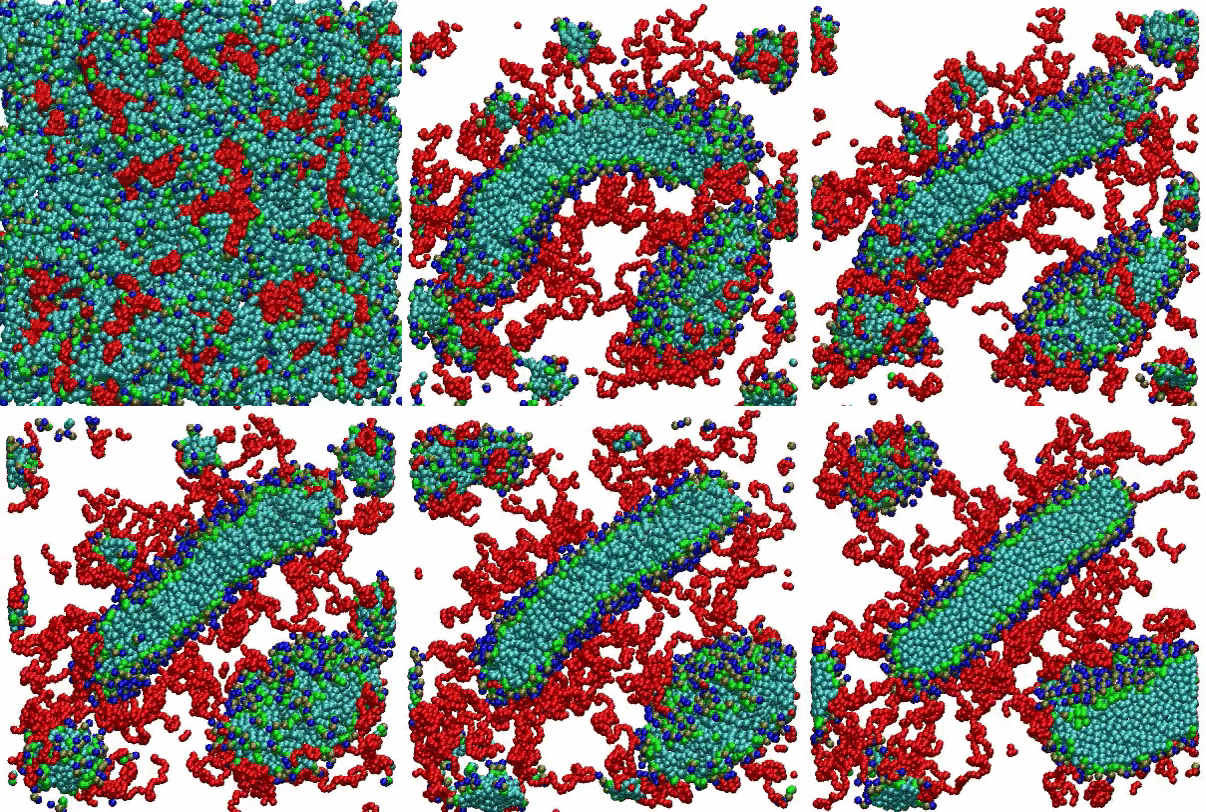
Coarse-grain models of lipid bilayers with different mole % of lipids with attached PEG polymers. Blue, green, and light blue spheres respectively represent head groups, glycerols, and tail groups of the DPPC (or DPPE) lipid, and red spheres represent PEG chains. For 99 mol %, PEG chains are represented as thin red lines. For clarity, a cross section of the system is depicted, and water and ions are omitted.
For the 2 mole % system, the initial randomized placement model converges to a vesicle, with some PEGylated lipids seen on both the inside and outside surfaces. For the 10 mole % system, disk-shaped bicelles are formed, while at 100 mole % small micelles are observed.
Citation: A coarse-grained model for PEGylated lipids: the effect of PEGylation on size and shape of self-assembled structures, Hwankyu Lee and Richard W. Pastor, J. Phys. Chem. B., 115, 7830-7837 (2011).
VMD movie of Bilayer Undulations

Small amplitude wave-like motions are observed in the large, fairly flat lipid bilayer model; the size is 100x100 nm, or roughly 400 times larger than typical all-atom simulations. Citation: Large scale coarse grained model of a DPPC bilayer; unpublished work by Hwankyu Lee and Richard W. Pastor.
VMD movie of Bilayer Undulations
One lipid in each leaflet is shown as heavy atom spheres, with the rest depicted as heavy atom bonds (sticks); carbon atoms are colored cyan, except for the lipid beta chain (chain 2), which has yellow C atoms. Lipid O atoms are red, and the P atom is gold-brown. The lipids are seen to undergo frequent changes of conformation on this 20 ns timescale, esp. in the chains, while lateral diffusion is considerably slower. Citation: An Ab Initio Study on the Torsional Surface of Alkanes and its Effect on Molecular Simulations of Alkanes and a DPPC Bilayer, Jeffery B. Klauda, Bernard R. Brooks, Alexander D. MacKerell, Jr., Richard M. Venable, and Richard W. Pastor, J. Phys. Chem. B. 109, 5300-5311 (2005).
Water Crossing Event from Simulation III
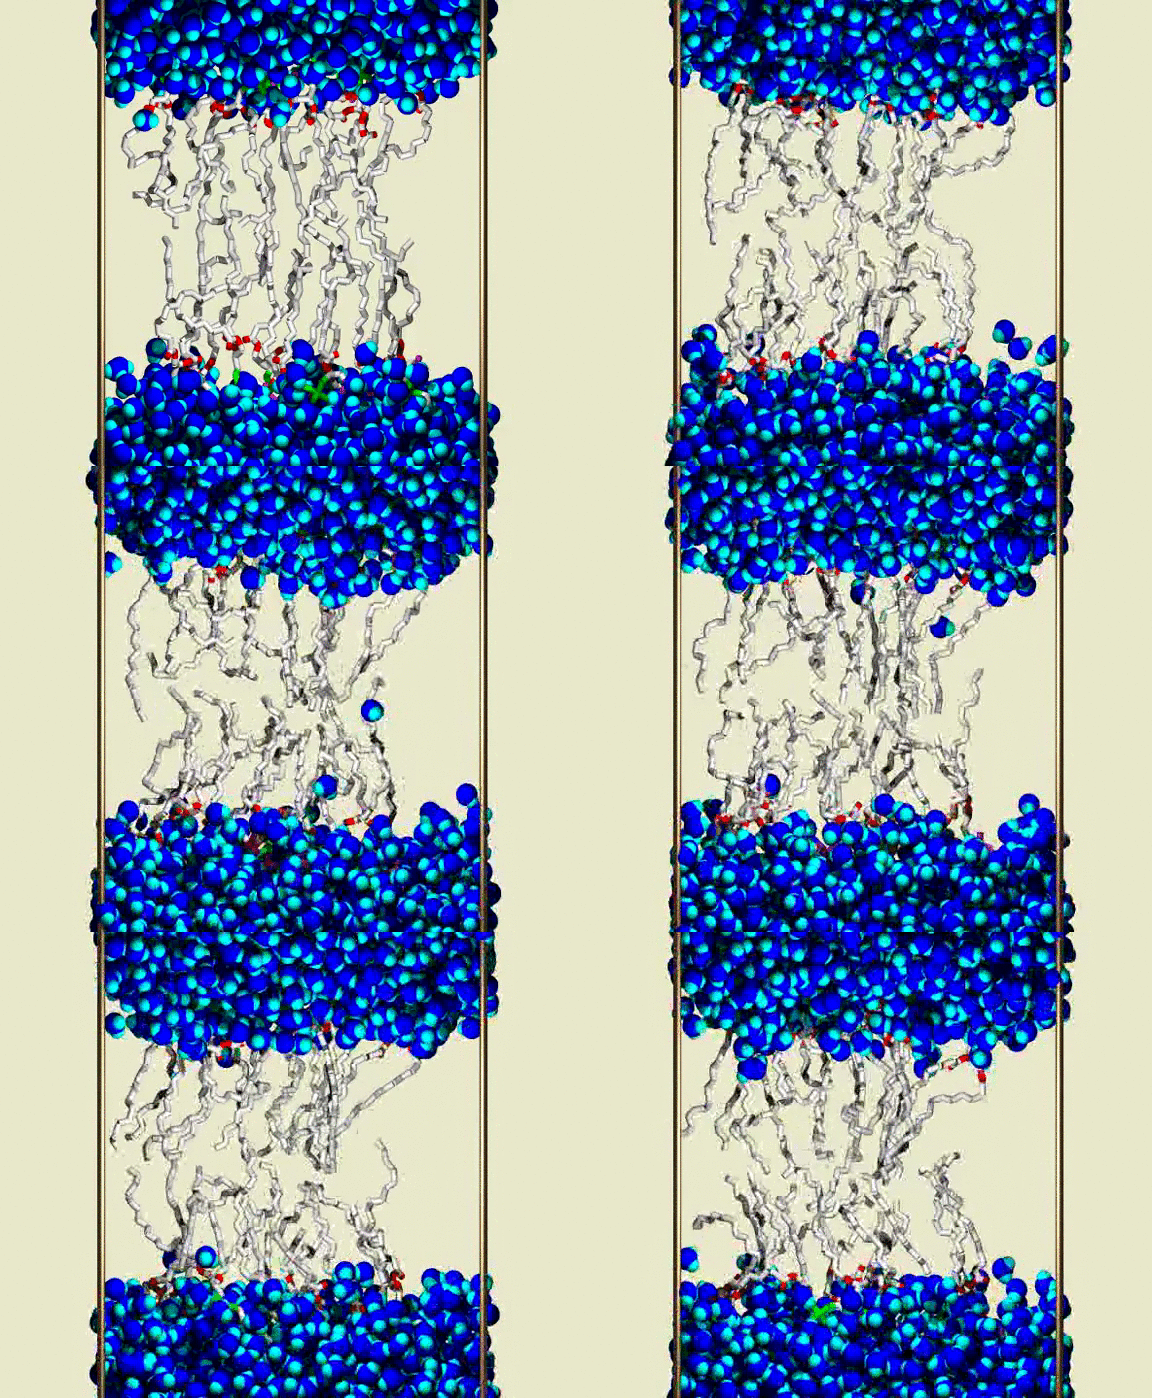
A solvated DPPC bilayer, with most of the lipids omitted; waters are shown as blue spheres for each atom, with bright blue (cyan) for the H atoms. The lipid coloring is gray for the C atoms, red for the ester O atoms, green for the PO4 group, and purple for the choline N and C atoms. The simulation unit cell boundary is shown by vertical metallic rods. A row of about 16 of the 72 lipids are shown as bond cylinders, in the central region between the upper and lower water phases. The lipids wiggle and jiggle, while water molecules are highly mobile within the bulk water and lipid heagroup regions. Partway through the animation, a single water molecule is seen to enter the chain region from lower aqueous region, and pass through the chains to the upper aqueous region. The animation shows a 400 ps interval from the simulation, with frames at 1 ps. Citation: Lipid Bilayers, NMR Relaxation, and Computer Simulations, Richard W. Pastor, Richard M. Venable, Scott E. Feller, Accounts of Chemical Research 35, 438-446 (2002).
Lipid Bilayer Water Wire Breaking
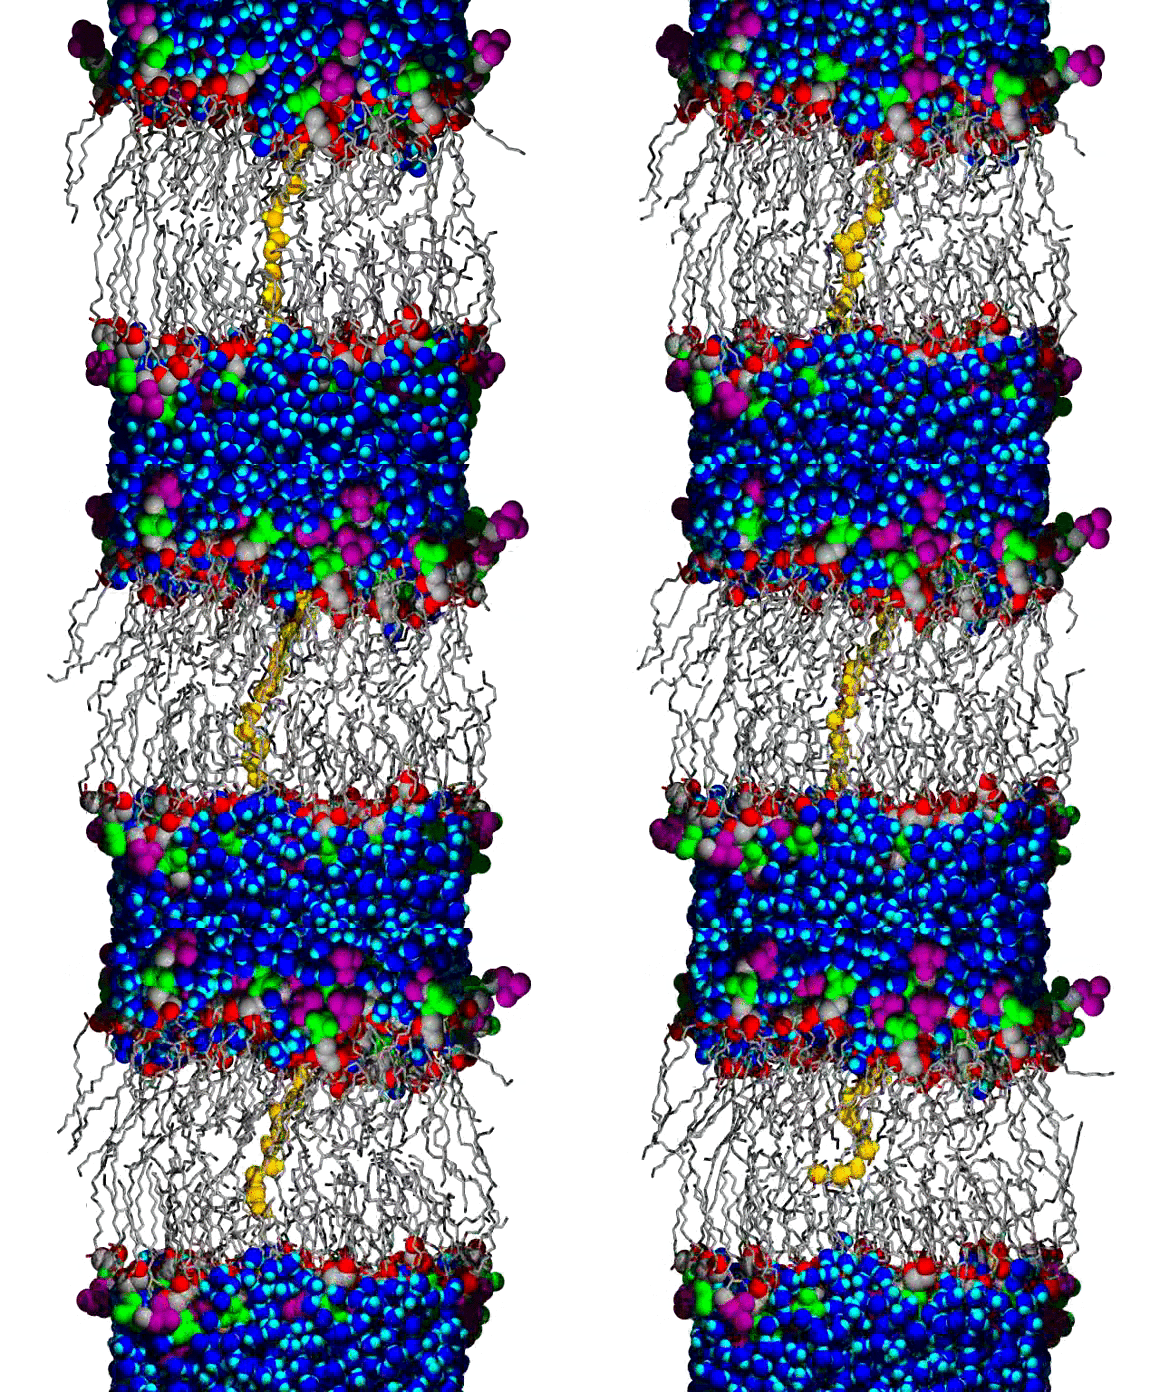
A water wire across the chain region of a DPPC lipid bilayer; water and lipid headgroup heavy atoms are shown as spheres, and the lipid hydrocarbon chains are shown as slender bond cylinders. Water molecules are blue, with bright blue for the H atoms, except for the wire, which is colored orange (O atoms) and yellow (H atoms). The lipid coloring is gray for most C atoms, red for the ester O atoms, green for the PO4 group, and purple for the choline N and C atoms. The animation begins with a single file line of water molecules through the chain region, from the upper to the lower aqueous region. The water wire remains intact for about 100 ps of the 160 ps animation; a break occurs near the lower aqueous region and the wire begins to curl toward the upper region, increasing the size of the gap. Citation: Molecular Dynamics Simulations of Water Wires and Water/Octane Model Systems, Richard M. Venable and Richard W. Pastor, J. Chem. Phys. 116, 2663-2664 (2002).
Animations of the ca. 63 A2 Area/lipid Simulation
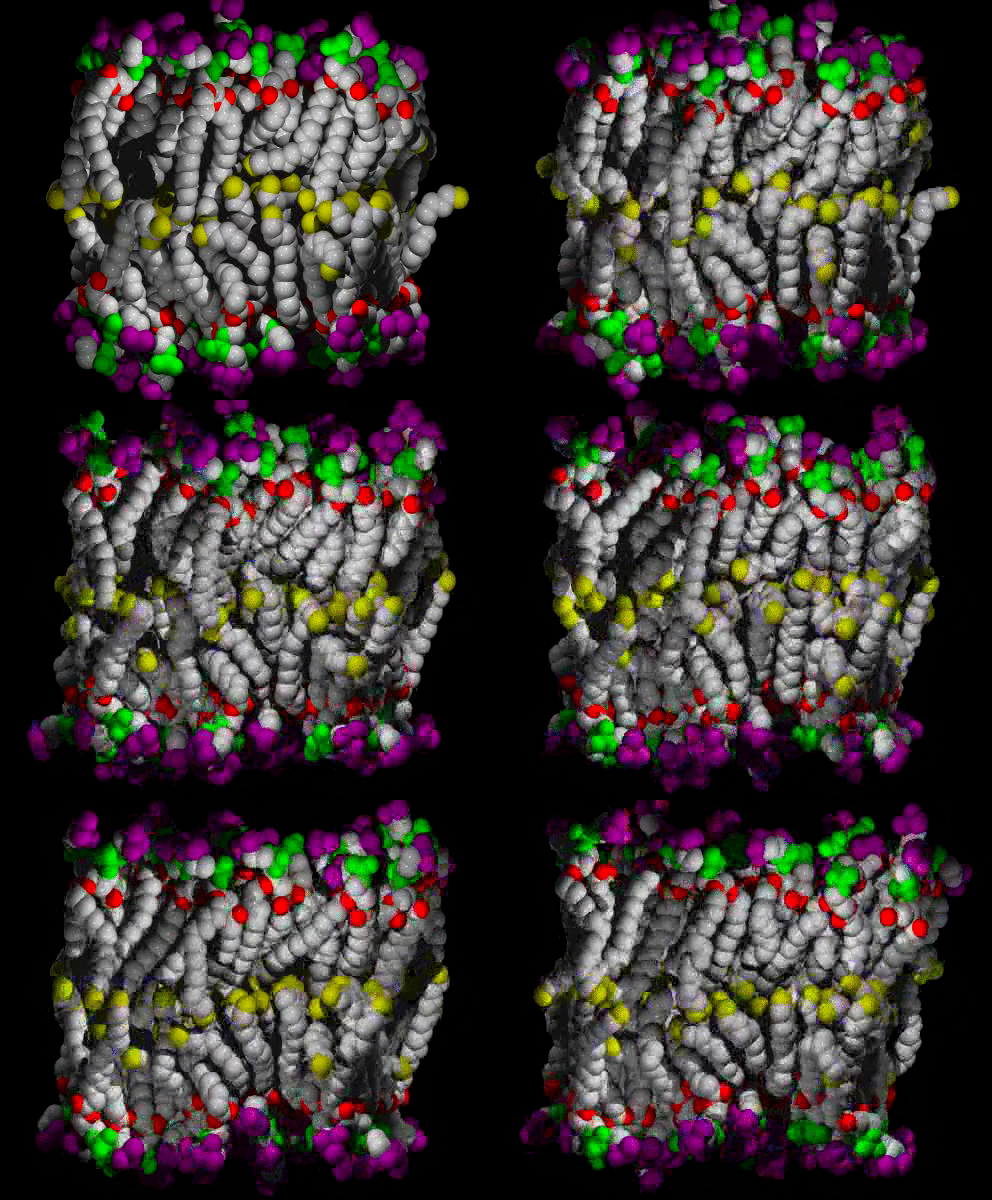
A small patch of solvated DPPC bilayer, with heavy atoms (C,N,O,P) shown as spheres, colored by molecular fragment: BLUE = water O, GRAY = lipid C, RED = lipid ester O, GREEN = phosphate, PURPLE = choline, YELLOW = methyl at chain ends. The view is of one edge of the simulation unit cell, with a symmetric vertical layered structure of water, interface, hydrocarbon chains, interface, water clearly visible. The time range is 400 ps in 1 ps snapshots; the water can be seen moving freely in and out of the interface region, and sometimes staying near an ester group, at the boundary between the interface and hydrocarbon chain regions. The lipids wiggle about as they are jostled by the water and each other, but they do not exchange places.

The same as above, but with the water atoms omitted so that more details of the lipids can be seen.
Citation: Computer simulation of a DPPC phospholipid bilayer: Structural Changes as a Function of Molecular Surface area, Scott E. Feller, Richard M. Venable and Richard W. Pastor, Langmuir 13, 6555-6561 (1997).

